반응형
1. Apache 설정
$ vi /etc/httpd/conf.modules.d/00-base.conf LoadModule status_module modules/mod_status.so

$ cat /etc/httpd/conf.d/server-status.conf
# 아래 내용 추가
<Location "/server-status">
SetHandler server-status
Require ip xxx.xxx.xxx.xxx/32
Require host localhost #uncomment to only allow requests from localhost

$ service httpd restart
Redirecting to /bin/systemctl restart httpd.service

$ netstat -nltp
Active Internet connections (only servers)
Proto Recv-Q Send-Q Local Address Foreign Address State PID/Program name
tcp 0 0 0.0.0.0:10050 0.0.0.0:* LISTEN 30403/zabbix_agentd tcp 0 0 0.0.0.0:22 0.0.0.0:* LISTEN 1113/sshd
tcp 0 0 127.0.0.1:25 0.0.0.0:* LISTEN 1020/master
tcp6 0 0 :::10050 :::* LISTEN 30403/zabbix_agentd
tcp6 0 0 :::80 :::* LISTEN 31563/httpd
tcp6 0 0 :::22 :::* LISTEN 1113/sshd
tcp6 0 0 ::1:25 :::* LISTEN 1020/master

# CURL로 질의했을때, 정보가 뜨면 정상적으로 뜨고 있는겁니다.
$ curl localhost/server-status
<!DOCTYPE HTML PUBLIC "-//W3C//DTD HTML 3.2 Final//EN">
<html><head>
<title>Apache Status</title>
</head><body>
<h1>Apache Server Status for localhost (via ::1)</h1>

<dl><dt>Server Version: Apache/2.4.6 (CentOS)</dt>
<dt>Server MPM: prefork</dt>
<dt>Server Built: Nov 16 2020 16:18:20
</dt></dl><hr /><dl>
<dt>Current Time: Sunday, 14-Mar-2021 16:41:40 KST</dt>
<dt>Restart Time: Sunday, 14-Mar-2021 16:25:54 KST</dt>
<dt>Parent Server Config. Generation: 1</dt>
<dt>Parent Server MPM Generation: 0</dt>
<dt>Server uptime:  15 minutes 46 seconds</dt>
<dt>Server load: 0.00 0.01 0.05</dt>
<dt>Total accesses: 0 - Total Traffic: 0 kB</dt>
<dt>CPU Usage: u0 s0 cu0 cs0<dt>0 requests/sec - 0 B/second - </dt>
<dt>1 requests currently being processed, 4 idle workers</dt>
</dl><pre>____W...........................................................
................................................................
................................................................
................................................................
</pre>
<p>Scoreboard Key:<br />
"<b><code>_</code></b>" Waiting for Connection,
"<b><code>S</code></b>" Starting up,
"<b><code>R</code></b>" Reading Request,<br />
"<b><code>W</code></b>" Sending Reply,
"<b><code>K</code></b>" Keepalive (read),
"<b><code>D</code></b>" DNS Lookup,<br />
"<b><code>C</code></b>" Closing connection,
"<b><code>L</code></b>" Logging,
"<b><code>G</code></b>" Gracefully finishing,<br />
"<b><code>I</code></b>" Idle cleanup of worker,
"<b><code>.</code></b>" Open slot with no current process<br />
<p />


<table border="0"><tr><th>Srv</th><th>PID</th><th>Acc</th><th>M</th><th>CPU
</th><th>SS</th><th>Req</th><th>Conn</th><th>Child</th><th>Slot</th><th>Client</th><th>VHost</th><th>Request</th></tr>

<tr><td><b>4-0</b></td><td>19449</td><td>0/0/0</td><td><b>W</b>
</td><td>0.00</td><td>0</td><td>0</td><td>0.0</td><td>0.00</td><td>0.00
</td><td>::1</td><td nowrap>127.0.0.1:80</td><td nowrap>GET /server-status HTTP/1.1</td></tr>

</table>
 <hr /> <table>
 <tr><th>Srv</th><td>Child Server number - generation</td></tr>
 <tr><th>PID</th><td>OS process ID</td></tr>
 <tr><th>Acc</th><td>Number of accesses this connection / this child / this slot</td></tr>
 <tr><th>M</th><td>Mode of operation</td></tr>
<tr><th>CPU</th><td>CPU usage, number of seconds</td></tr>
<tr><th>SS</th><td>Seconds since beginning of most recent request</td></tr>
 <tr><th>Req</th><td>Milliseconds required to process most recent request</td></tr>
 <tr><th>Conn</th><td>Kilobytes transferred this connection</td></tr>
 <tr><th>Child</th><td>Megabytes transferred this child</td></tr>
 <tr><th>Slot</th><td>Total megabytes transferred this slot</td></tr>
 </table>
</body></html>
zabbix 서버쪽에서도 정상적으로 체크되는지 확인합니다.
$ curl IP/server-status
<!DOCTYPE HTML PUBLIC "-//W3C//DTD HTML 3.2 Final//EN">
<html><head>
<title>Apache Status</title>
</head><body>
<h1>Apache Server Status for xxx.xxx.xxx.xxx (via xxx.xxx.xxx.xxx)</h1>

<dl><dt>Server Version: Apache/2.4.6 (CentOS)</dt>
<dt>Server MPM: prefork</dt>
<dt>Server Built: Nov 16 2020 16:18:20
</dt></dl><hr /><dl>
<dt>Current Time: Sunday, 14-Mar-2021 16:42:59 KST</dt>
<dt>Restart Time: Sunday, 14-Mar-2021 16:25:54 KST</dt>
<dt>Parent Server Config. Generation: 1</dt>
<dt>Parent Server MPM Generation: 0</dt>
<dt>Server uptime:  17 minutes 5 seconds</dt>
<dt>Server load: 0.00 0.01 0.05</dt>
<dt>Total accesses: 1 - Total Traffic: 2 kB</dt>
<dt>CPU Usage: u0 s0 cu0 cs0<dt>.000976 requests/sec - 1 B/second - 2048 B/request</dt>
<dt>1 requests currently being processed, 4 idle workers</dt>
</dl><pre>W____...........................................................
................................................................
................................................................
................................................................
</pre>
<p>Scoreboard Key:<br />
"<b><code>_</code></b>" Waiting for Connection,
"<b><code>S</code></b>" Starting up,
"<b><code>R</code></b>" Reading Request,<br />
"<b><code>W</code></b>" Sending Reply,
"<b><code>K</code></b>" Keepalive (read),
"<b><code>D</code></b>" DNS Lookup,<br />
"<b><code>C</code></b>" Closing connection,
"<b><code>L</code></b>" Logging,
"<b><code>G</code></b>" Gracefully finishing,<br />
"<b><code>I</code></b>" Idle cleanup of worker,
"<b><code>.</code></b>" Open slot with no current process<br />
<p />


<table border="0"><tr><th>Srv</th><th>PID</th><th>Acc</th><th>M</th><th>CPU
</th><th>SS</th><th>Req</th><th>Conn</th><th>Child</th><th>Slot</th><th>Client</th><th>VHost</th><th>Request</th></tr>

<tr><td><b>0-0</b></td><td>19445</td><td>0/0/0</td><td><b>W</b>
</td><td>0.00</td><td>0</td><td>0</td><td>0.0</td><td>0.00</td><td>0.00
</td><td>xxx.xxx.xxx.xxx</td><td nowrap>127.0.0.1:80</td><td nowrap>GET /server-status HTTP/1.1</td></tr>

<tr><td><b>4-0</b></td><td>19449</td><td>0/1/1</td><td>_
</td><td>0.00</td><td>78</td><td>1</td><td>0.0</td><td>0.00</td><td>0.00
</td><td>localhost</td><td nowrap>127.0.0.1:80</td><td nowrap>GET /server-status HTTP/1.1</td></tr>

</table>
 <hr /> <table>
 <tr><th>Srv</th><td>Child Server number - generation</td></tr>
 <tr><th>PID</th><td>OS process ID</td></tr>
 <tr><th>Acc</th><td>Number of accesses this connection / this child / this slot</td></tr>
 <tr><th>M</th><td>Mode of operation</td></tr>
<tr><th>CPU</th><td>CPU usage, number of seconds</td></tr>
<tr><th>SS</th><td>Seconds since beginning of most recent request</td></tr>
 <tr><th>Req</th><td>Milliseconds required to process most recent request</td></tr>
 <tr><th>Conn</th><td>Kilobytes transferred this connection</td></tr>
 <tr><th>Child</th><td>Megabytes transferred this child</td></tr>
 <tr><th>Slot</th><td>Total megabytes transferred this slot</td></tr>
 </table>
</body></html>
2. 템플릿 추가

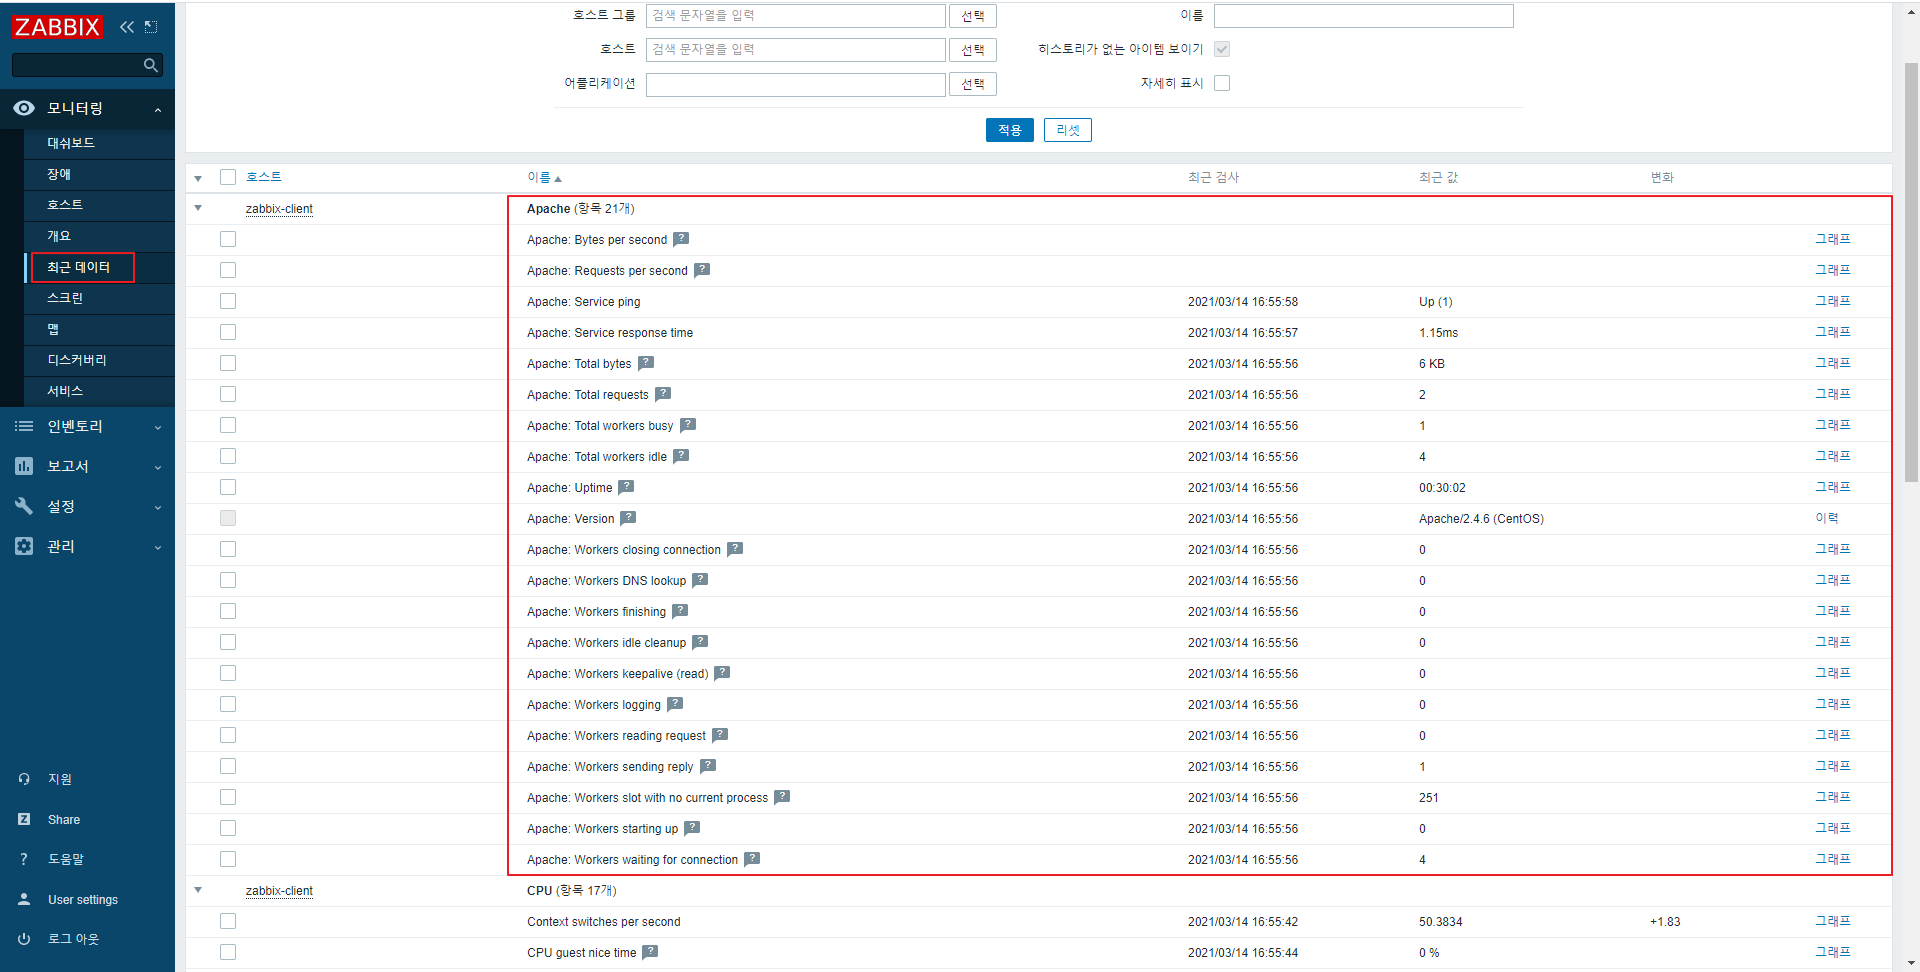
** 참고 **
단순 포트만 체크하려면 아래와 같은 템플릿을 이용하면 됩니다.


참고) www.tecmint.com/monitor-apache-performance-using-netdata-on-centos/
반응형
'MONITORING' 카테고리의 다른 글
| [Zabbix] Mysql DB 모니터링 (0) | 2021.03.14 |
|---|---|
| [Zabbix] telegram 연동 (0) | 2021.03.14 |
| [Zabbix] zabbix-agent 5.2 설치 (0) | 2021.03.13 |
| [Zabbix] Zabbix 5.2 설치(ubuntu 18.04) (0) | 2021.03.13 |
| NSClient++ 로 윈도우 서버 모니터링 (0) | 2020.06.30 |
